Owner profile
Owner age, household composition, employment, mortgage status and housing equity.
The market that must absorb private new vehicles, used imports and rental disposals—and ultimately determines sustainable fleet growth.
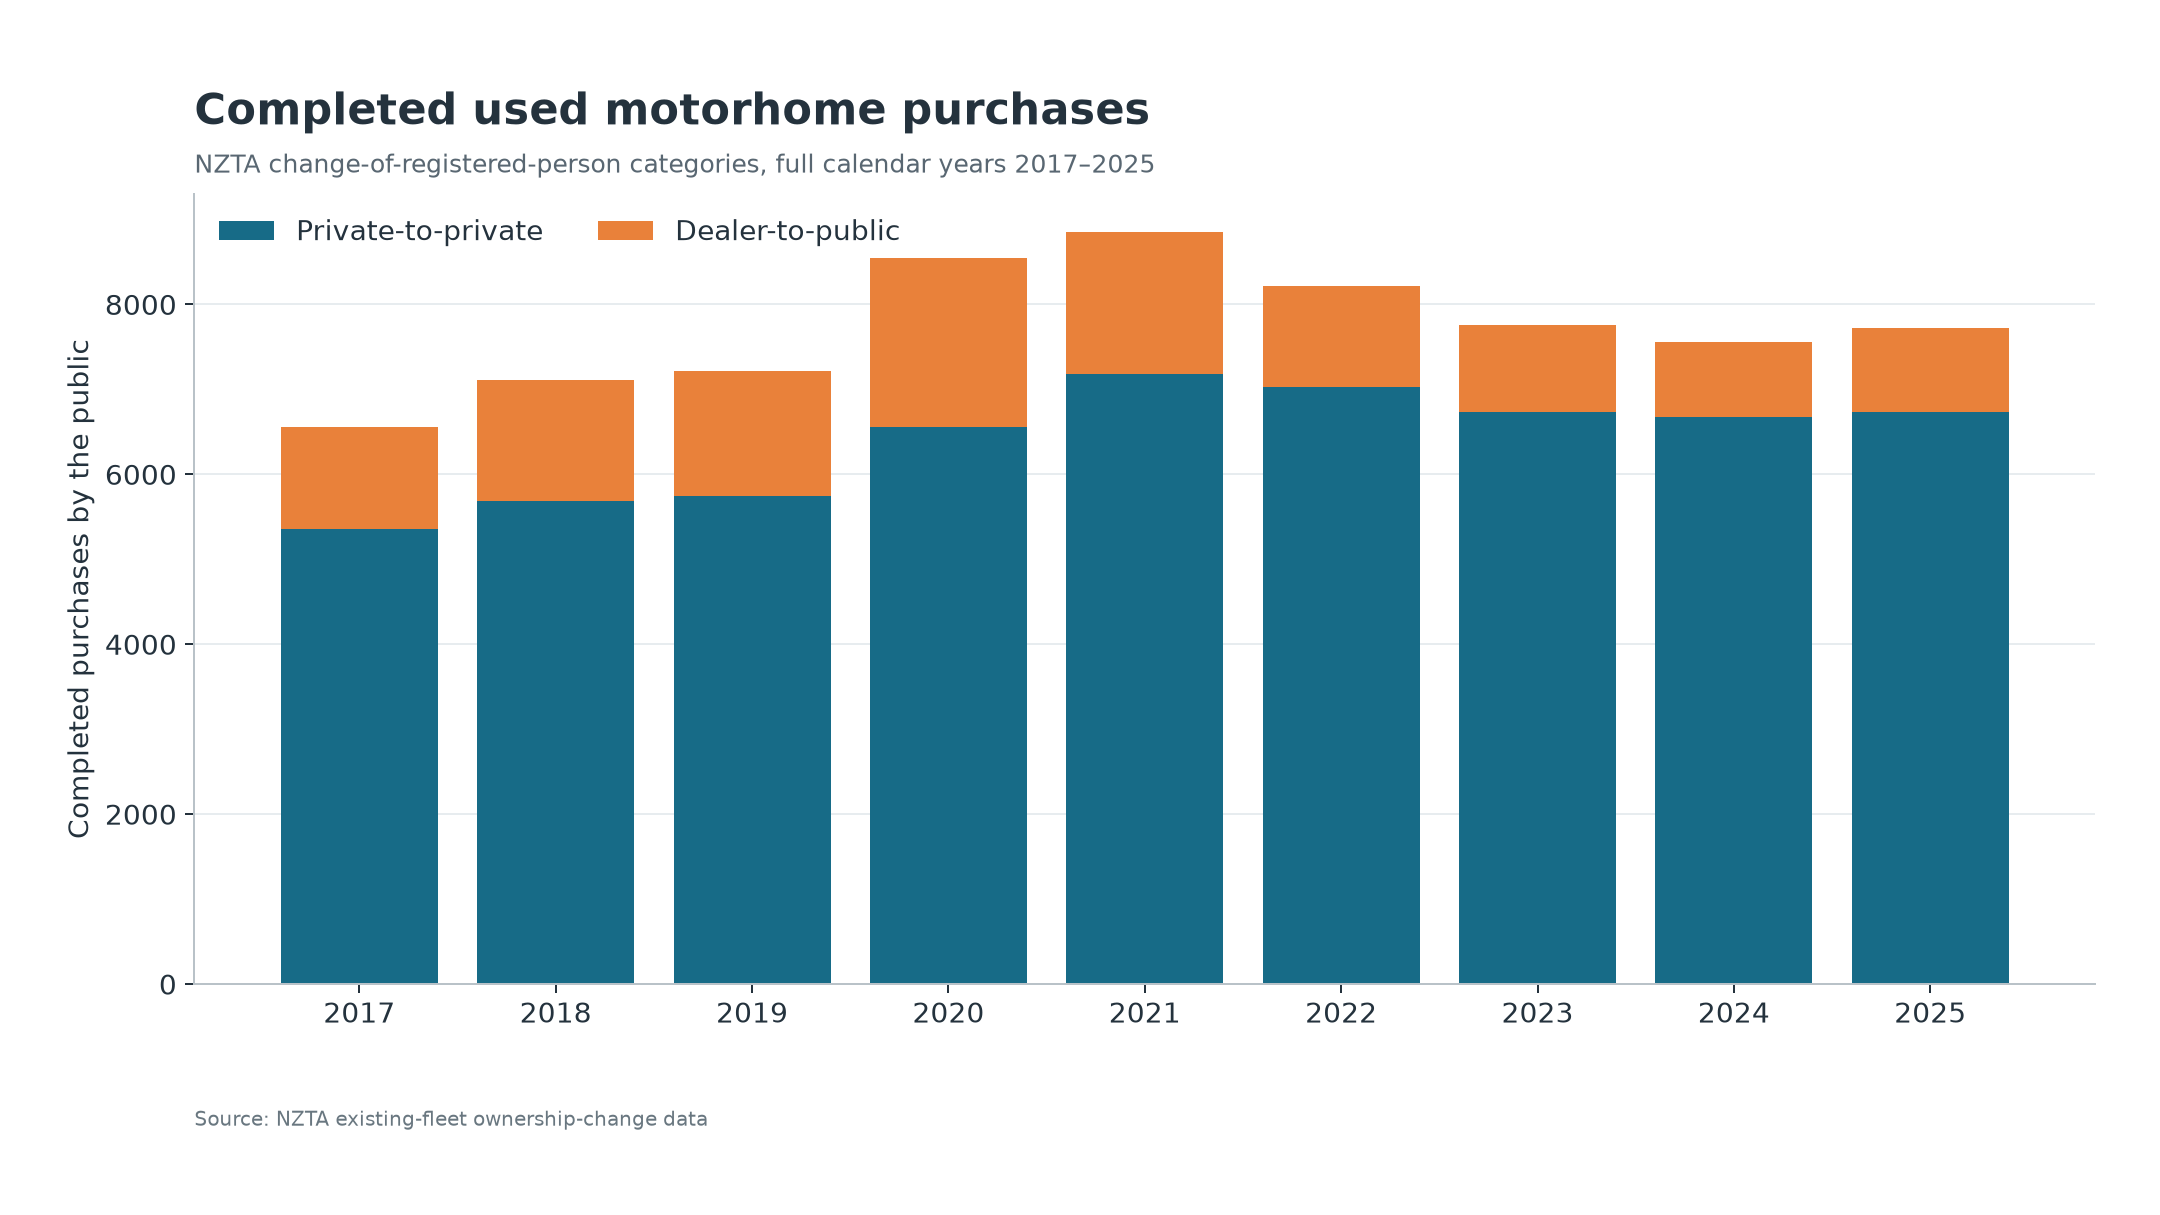
Direct owner-to-owner sales dominate because dealer trade-in margins are large in dollar terms, dealer stock turns slowly and high-value habitation risk is difficult to warranty.
This market can continue trading while the dealer channel slows: willing buyer and willing seller agree a price. But total fleet growth still requires households new to ownership.
Evidence note: The four transaction channels sum to 8,600 completed transfers in 2025. Purchases made by members of the public totalled 7,723: 6,735 from another private owner and 988 from a trader.
The preferred denominator is households containing at least one person aged 65 or over, not individual older people. A retired couple is usually one purchasing household.
The central 2026 estimate of 663,000 older households and 49,783 private-use motor caravans produces approximately 75 vehicles per 1,000 households. This is a fleet-equivalent measure: not every vehicle is owned by an older household and some households may own more than one.
| 2033 scenario | Interpretation | Average annual absorption |
|---|---|---|
| Penetration unchanged | Incoming households own at today's rate | ≈1,430 |
| Penetration 5% lower | More debt or weaker ownership propensity | ≈1,000 |
| Penetration 15% lower | Demographic growth mostly offset | Minimal headroom |
Tauranga City has 2,466 privately used motorhomes, or 15.32 per 1,000 residents. Western Bay of Plenty has 920, or 15.31 per 1,000. Both are approximately 64% above the national rate of 9.35. Tasman and Thames-Coromandel are higher still, at 28.26 and 26.15 respectively.
Across all 67 districts and cities, the correlation between motorhome penetration and the share of residents aged 65+ is 0.82. This supports an association with older populations; it does not establish the age or retirement status of individual owners.
Evidence note: NZTA fleet: 30 June 2026, using the project snapshot convention. Stats NZ population and age estimates: 30 June 2025, provisional. Rates below use all residents, unlike the older-household scenario above. They count vehicles, not unique owners or households.
Each dot is one district or city. The highlighted dot is Tauranga. The dashed line is the national motorhome rate. Areas with older populations generally have higher penetration (correlation 0.82).
| Area | Private fleet | Per 1,000 residents | NZ = 100 | Residents 65+ |
|---|---|---|---|---|
| Tasman | 1,693 | 28.26 | 302 | 24.5% |
| Kaikoura | 115 | 26.50 | 283 | 28.8% |
| Thames-Coromandel | 842 | 26.15 | 280 | 35.4% |
| Buller | 265 | 24.88 | 266 | 28.6% |
| Waimate | 192 | 22.72 | 243 | 23.9% |
| Central Otago | 558 | 21.63 | 231 | 25.2% |
| Timaru | 1,068 | 21.58 | 231 | 23.2% |
| Hauraki | 474 | 21.45 | 229 | 26.7% |
| Marlborough | 1,073 | 21.12 | 226 | 24.4% |
| Hurunui | 300 | 20.91 | 224 | 24.4% |
| Mackenzie | 113 | 20.47 | 219 | 18.8% |
| Waimakariri | 1,383 | 19.81 | 212 | 22.6% |
| Waitaki | 487 | 19.80 | 212 | 24.4% |
| Stratford | 204 | 19.43 | 208 | 19.0% |
| Central Hawke’s Bay | 296 | 18.56 | 198 | 22.6% |
| Tararua | 350 | 18.47 | 198 | 21.6% |
| Westland | 172 | 18.24 | 195 | 22.5% |
| Gore | 228 | 17.61 | 188 | 22.0% |
| Horowhenua | 674 | 17.55 | 188 | 25.0% |
| Taupo | 733 | 17.17 | 184 | 21.3% |
| Nelson | 921 | 16.96 | 181 | 22.5% |
| Carterton | 174 | 16.89 | 181 | 26.7% |
| New Plymouth | 1,496 | 16.60 | 178 | 20.4% |
| Whangarei | 1,649 | 16.39 | 175 | 21.5% |
| Masterton | 472 | 16.33 | 175 | 23.2% |
| South Taranaki | 485 | 16.28 | 174 | 18.5% |
| Grey | 236 | 16.16 | 173 | 21.6% |
| Kaipara | 420 | 15.67 | 168 | 25.4% |
| Kapiti Coast | 903 | 15.57 | 167 | 27.2% |
| Ashburton | 578 | 15.45 | 165 | 19.5% |
| Tauranga | 2,466 | 15.32 | 164 | 19.6% |
| Western Bay of Plenty | 920 | 15.31 | 164 | 23.3% |
| Rangitikei | 238 | 14.88 | 159 | 20.9% |
| Matamata-Piako | 577 | 14.72 | 157 | 21.9% |
| South Wairarapa | 178 | 14.59 | 156 | 24.6% |
| Kawerau | 111 | 14.45 | 155 | 20.7% |
| Waipa | 871 | 14.00 | 150 | 20.1% |
| Southland | 466 | 13.75 | 147 | 17.7% |
| Whanganui | 674 | 13.70 | 147 | 22.8% |
| Clutha | 257 | 13.67 | 146 | 20.2% |
| Far North | 980 | 13.30 | 142 | 23.2% |
| Whakatane | 489 | 12.73 | 136 | 20.3% |
| Ruapehu | 170 | 12.64 | 135 | 19.7% |
| Waitomo | 125 | 12.56 | 134 | 18.4% |
| Napier | 822 | 12.38 | 132 | 21.4% |
| Invercargill | 695 | 11.98 | 128 | 18.6% |
| South Waikato | 300 | 11.54 | 123 | 17.7% |
| Queenstown-Lakes | 617 | 11.47 | 123 | 12.3% |
| Manawatu | 370 | 10.88 | 116 | 20.3% |
| Opotiki | 110 | 10.68 | 114 | 21.4% |
| Rotorua | 813 | 10.42 | 111 | 15.9% |
| Gisborne | 526 | 9.98 | 107 | 17.1% |
| Hastings | 881 | 9.98 | 107 | 18.2% |
| Otorohanga | 98 | 9.16 | 98 | 17.3% |
| Dunedin | 1,155 | 8.70 | 93 | 17.8% |
| Selwyn | 756 | 8.63 | 92 | 13.6% |
| Christchurch | 3,479 | 8.30 | 89 | 16.5% |
| Wairoa | 74 | 8.28 | 89 | 19.1% |
| Waikato | 736 | 8.08 | 86 | 15.1% |
| Palmerston North | 718 | 7.93 | 85 | 16.1% |
| Hamilton | 1,190 | 6.19 | 66 | 12.2% |
| Upper Hutt | 293 | 6.18 | 66 | 16.7% |
| Porirua | 298 | 4.85 | 52 | 13.8% |
| Lower Hutt | 499 | 4.37 | 47 | 15.1% |
| Auckland | 7,564 | 4.17 | 45 | 13.4% |
| Chatham Islands Territory | 2 | 3.23 | 35 | 17.7% |
| Wellington | 599 | 2.84 | 30 | 12.3% |
The relationship remains strong when areas below 10,000 residents are excluded (0.83), and when Auckland, Wellington, Christchurch and Hamilton are excluded (0.78). It also holds for private motorhomes under ten years old (0.66). Wealth, urban density, parking and touring preferences may also contribute.
Evidence note: Private passenger usage excludes 6,060 rentals and 243 other-use vehicles. The broad motor-caravan fleet includes conversions and differs from the refined commercial additions scope. Unknown/overseas locations contain 112 private vehicles (0.22%): included nationally, excluded from district comparisons. Definitions and regional methodology ↗
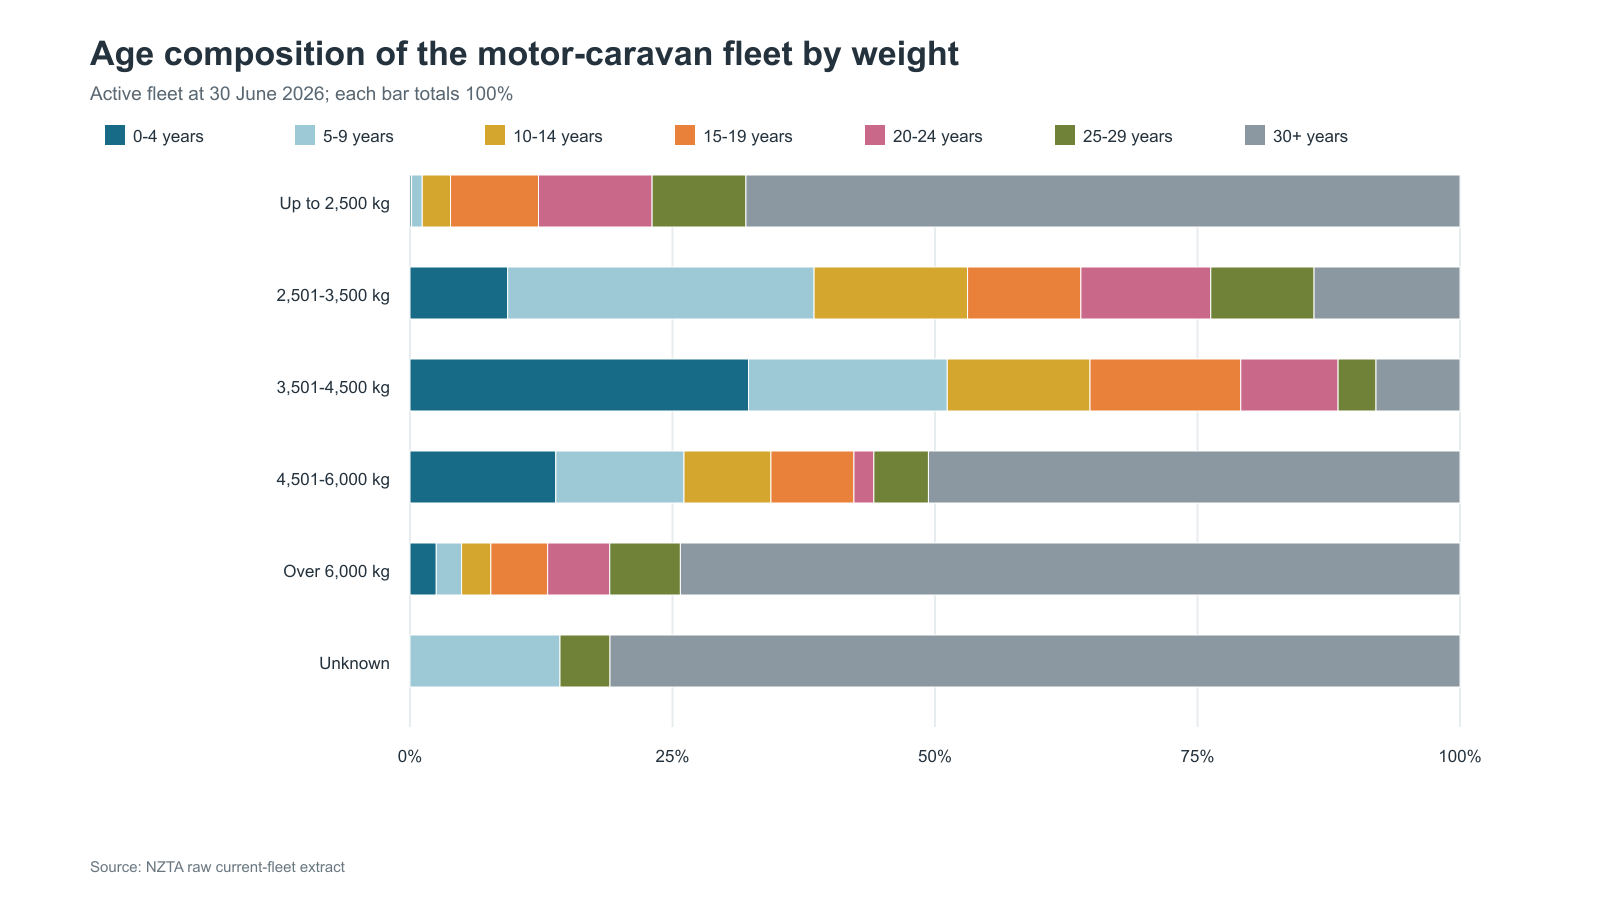
The 19-year median covers small Japanese campervans, current coachbuilts, converted buses, horse trucks and home-built vehicles. Weight and vehicle form are needed before drawing conclusions about replacement demand.
Old vehicles do not necessarily exit when a new motorhome is sold. They can move down the price ladder and remain active, so every net addition may still require another ownership position.
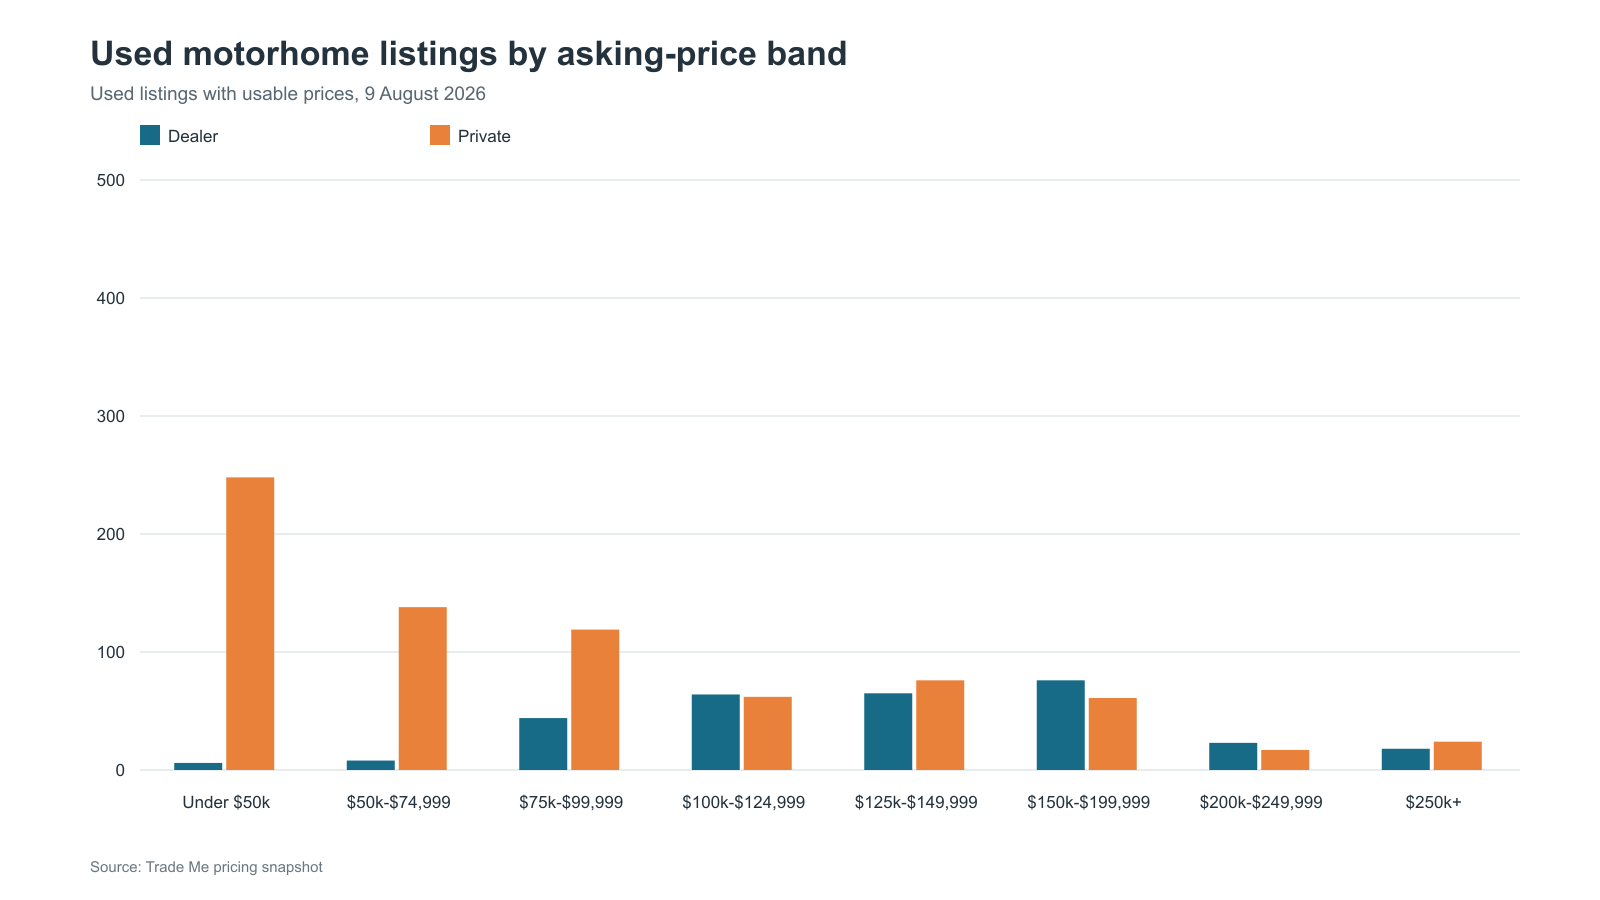
The pre-COVID trade valuation rule—8% depreciation in year one and 5% each year after—was disrupted. Rapid new-price inflation has allowed many owners to ask close to what they originally paid despite additional age and kilometres.
That does not mean every vehicle holds value equally. Provenance, moisture history, parts support, layout, weight, kilometres and habitation wear become more important as the market separates.
The current analysis measures fleet and transactions well, but buyer behaviour still relies on demographic proxies and advertised prices.
Owner age, household composition, employment, mortgage status and housing equity.
First-time ownership, replacement purchases, reasons for selling and time held.
Sale price, time to sale and discount from first asking price by channel and vehicle type.
Extend the vehicle-per-resident evidence above with unique owning households and a consistent older-household denominator.